
Fleet operators report robot counts, uptime, and delivery volumes. The number that actually predicts whether the business scales is less flattering and rarely on the slide: robot fleet intervention rate, or how often a human has to step in.
This guide covers why intervention rate governs operating cost, how wide the real-world spread is, how to define the metric so it cannot be gamed, what to measure alongside it, and how to bring it down.
Why this is the number that matters
Fleet size is a vanity metric. Utilisation is a useful one. Intervention rate is the one that decides whether the business works.
The reason is that remote operations headcount scales with interventions, not with robots. A fleet that needs help once every thousand miles and one that needs help every mile can be identical in size and differ by orders of magnitude in operating cost. One of them can grow. The other pays for a new operator with every robot it deploys.
How wide the real spread is
California’s 2024 disengagement reporting makes the point better than any model. Waymo reported roughly one disengagement per 9,793 miles. May Mobility, running shuttles, reported intervention roughly every 0.66 miles.
Same industry, same year, same regulator. The gap between those two figures is the difference between a supervision function that is a rounding error and one that is the entire cost base.
Define it before you measure it
Intervention rate is easy to game and easy to misreport, mostly by accident. Fix the definition first.
| Decision | Options | Why it matters |
|---|---|---|
| Denominator | Miles, hours, tasks, deliveries | Miles flatter slow urban fleets; tasks flatter fast ones |
| What counts | All contacts, or only motion-affecting ones | Monitoring glances are not interventions |
| Robot-initiated vs operator-initiated | Separate or combined | Combining hides whether the robot knows it is stuck |
| Assistance vs driving | Separate always | They differ in cost and risk, per the mode split |
| Repeat events | One incident or several | A robot stuck three times in a minute is one problem |
| Scheduled checks | Excluded | Otherwise policy changes look like performance changes |
Write these down and version them. A rate that improves because the definition changed is the most common false victory in fleet operations.
Rate alone is not enough
Two fleets with identical intervention rates can have very different economics, because rate says nothing about how long each event takes.
- Mean time to resolve. The direct driver of operator load.
- Time to acknowledge. Queue depth and staffing adequacy, separate from difficulty.
- Time to resume autonomy. The commercial number, since this is what the customer experiences.
- Escalation rate to remote driving. A proxy for how good your assistance tooling is.
- Recurrence. Whether fixed clusters stay fixed.
- Concurrency. Peak simultaneous interventions, which sets staffing far more than the average does.
Operator load is roughly rate multiplied by resolution time. Both halves are levers, and resolution time is usually the cheaper one to move, since much of it is context-loading rather than genuine decision difficulty.
How to bring the rate down
Intervention rate does not fall because the fleet gets older. It falls because specific recurring failures get fixed, in priority order.
- Cluster, do not count. One robot stuck at one kerb is an anecdote. Two hundred stuck at similar kerbs is a work item. Clustering requires a controlled root-cause vocabulary rather than free text.
- Rank by frequency times cost. Not every failure deserves engineering effort. A rare failure that strands a vehicle on a road outranks a common one that delays a delivery by a minute.
- Separate policy problems from environment problems. Some clusters are fixed by retraining. Others are fixed by changing a route or a pickup point, which is usually faster and cheaper.
- Collect deliberately for the top clusters. Interventions tell you what to fix and rarely supply enough volume to fix it, per the intervention loop.
- Re-measure the cluster specifically. Fleet-wide rate is too noisy to prove a fix worked.
- Watch for displacement. A policy change that fixes one cluster and creates another is common, and invisible if you only track the aggregate.
This is the same targeting logic as long-tail capture, with the advantage that a deployed fleet tells you which tail entries actually occur.
What we track in practice
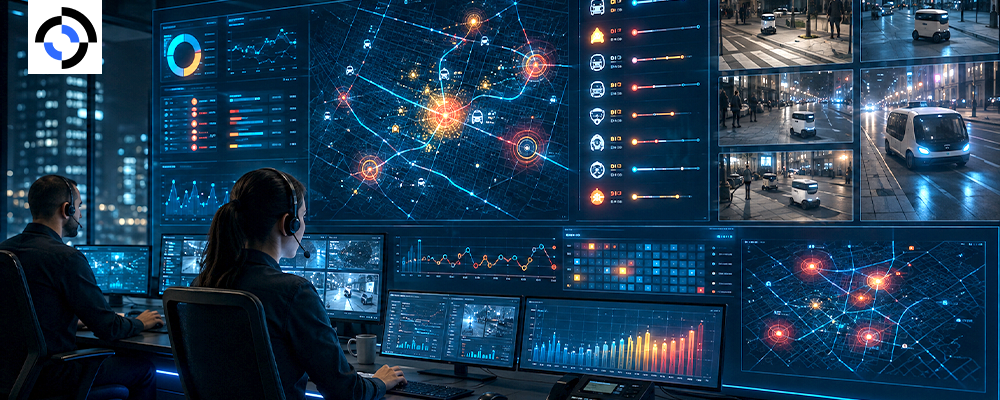
We run remote monitoring and intervention for an autonomous mobility company operating sidewalk delivery robots and self-driving passenger vehicles. Three reporting habits do most of the useful work.
- Rate by zone, not just by fleet. One construction site or one badly designed pickup point can dominate a month’s numbers, and a fleet-level average hides it completely.
- Rate by time of day. Crowds, light, and traffic all move the number. Staffing to the average guarantees understaffing at peak.
- Root cause assigned at resolution. By the operator who handled it, from a short fixed list, while context is fresh.
For a programme where targeted work on a specific failure class moved a hard metric, our warehouse policy case study tracks deformable-item success from 61 to 84 percent.
The trap in the target
Setting an intervention rate target creates pressure to intervene less, which is not the same as needing to intervene less.
Operators measured on low intervention counts wait longer before stepping in. Sometimes that is fine. Sometimes a robot sits blocking a doorway for four minutes because engaging would have registered as an intervention. The metric improved and the service got worse.
Guard against it by pairing the rate with time-to-resume and customer-facing outcomes, and by never making intervention count an individual operator performance measure. Measure operators on resolution quality and escalation accuracy instead, as covered in operator quality.
Frequently asked questions
What is a good intervention rate?
There is no universal figure, and published numbers vary enormously depending on environment, speed, and how the metric is defined. Your own trend line against a fixed definition is far more informative than any external benchmark.
Should robot-initiated and operator-initiated events be counted together?
Track both and report them separately. A robot that asks for help knows it is stuck, which is a healthier failure than one a human had to notice.
How does intervention rate relate to safety?
Indirectly and not simply. A high rate can mean a cautious system stopping often, which may be safe but uneconomic. Pair it with incident and near-miss data rather than treating it as a safety proxy.
How often should we review clusters?
Weekly at the cluster level, monthly for prioritisation. Reviewing only quarterly means a new recurring failure runs for months before anyone acts on it.
Intervention rate is the number that tells you whether adding robots adds margin or adds cost. If you want your definition, dashboard, and cluster process reviewed, tell us how your fleet is instrumented, or read more about our remote operations work.